|
Why Earthquakes are Happening More Frequently
A short history that everyone can verify without fear of "fake" news/ history/ science. In 1967 we began using the Atomic clock. This clock is based upon the oscillation of cesium 133, and it is accurate to 1 second per million years. By 1970, the earth had shown up late, and we were adding leap seconds to the atomic clock. We are now adding a second every 42-43 weeks. Scientists theorized as to why this was taking place, and the consensus argued that this was due to the moons orbit receding from the earth. In an effort to prove this, Apollo 15 on August 7, 1971, deployed the largest of the Laser Ranging Retro-reflectors that the US has placed upon the moons surface. · "Many of these measurements have been made by McDonald Observatory in Texas. From 1969 to 1985, they were made on a part-time basis using the McDonald Observatory 107-inch telescope. Since 1985, these observations have been made using a dedicated 30-inch telescope. Additional measurements have been made by observatories in Hawaii, California, France, Australia, and Germany. Laser beams are used because they remain tightly focused for large distances. Nevertheless, there is enough dispersion of the beam that it is about 7 kilometers in diameter when it reaches the Moon and 20 kilometers in diameter when it returns to Earth. Because of this very weak signal, observations are made for several hours at a time. By averaging the signal for this period, the distance to the Moon can be measured to an accuracy of about 3 centimeters (the average distance from Earth to the Moon is about 385,000 kilometers)."[Lunar and Planetary Institute] These data points that are produced are published; however, to access them is grueling; so, gleaning from the reports that are out there, it is between 3.8 and 6 cm per year. With this information available, Newton's laws of motion can be applied and we can calculate the conservation of motion, angular momentum and energy which is how the NASA team came up with the theory, initially. The resulting effect is a wobble in the earth's access known as "Chandler's Wobble". Seth Chandler, an astronomer from Boston, who determined this in 1891 and studied it for 3 decades. The original wobble was 6 meters +- and today, I have seen numbers starting at his original 6 meters up to 100 kilometers, while magnetic north is moving around 60 kilometers per year and the Tropic of Cancer continues an annual move; however, I can reference the producers of Laser ring gyros who are dealing with GPS to maintain proper course for Aircraft and build in adjustments for the wobble in their Algorithms. As Earth rotates on its axis, tidal friction is imposed on it through the gravitational attraction with the Moon and, to a lesser extent, the Sun. This secular acceleration gradually transfers angular momentum from Earth to the Moon. As Earth loses energy and slows down, the Moon gains this energy and its orbital period and distance from Earth increase.(Fred Espenak , Nasa/Goddard Space Flight Center) · · Therefore, there is strong evidence to support the postulation that the decay of the earth's spin is allowing an increase in the wobble of its axis resulting in an increase of earthquakes, geothermal vents,volcanoes,and that these factors are the primary causes of climate change. · But nobody can make money off of the truth; so, it's not getting a whole lot of press. |
Chandler's Wobble
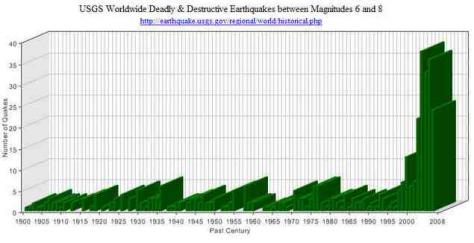
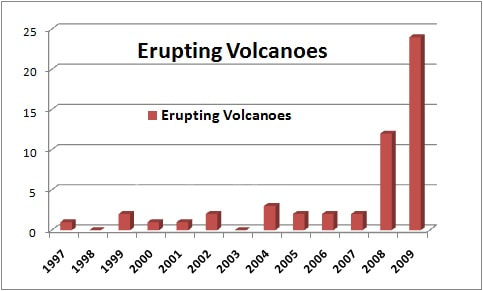
The graph above has created a great deal of controversy, which has caused many to respond to the information as alarmist and conspiratorial; however, I have been watching the reports since 1982, and I can speak to the authenticity of this trend. Test all the sights at the larger schools worldwide rather than relying on one US based operation. Above, you will find buttons to several quake sites where you can research the trend for yourself. In the graph below, you can see a similar trend taking place regarding volcanic activity.
|